How Semaphore Calculates Percentage-Based Rollouts
Tags: #semaphore, #open source
When I first started learning about feature flags, I found it all somewhat interesting but predictable. So while I was excited about the prospect of using this new tool, it didn't pose any interesting challenges. That was... until I heard about percentage based rollouts. This was a problem that didn't seem (to me, at least) to have an obvious solution, and so I couldn't stop thinking about it.
I imagined different possible implementations, and found flaws in them all. How was it decided which users would get it? Was it the first N% of users that got to the feature? Surely there's an element of randomness to it so that you don't choose the same people every time you roll a flag out to 20% of users, right?
If you listen to my podcast, then you've probably heard this already, but the short version is that basically you get some inputs that represent the user, and then you deterministically convert that into a number that you can represent as a percentage (e.g. 0-100 or 0-1), and if the user's percentage is <= the rollout percentage, then the user has that flag turned on.
It sounds simple, but it's kinda not. How do you take an arbitrary chunk of data and deterministically convert it into a number?
I'm not aware of any CFML or Java methods that do this for you. Actually, that's a lie. I am, but once again I'm thwarted by differences in CFML engines. Java's string.hashCode() method does return an integer value, but is not usefully implemented across all CFML engines. Still, even if that were an option, getting from an object to a string in a deterministic manner is, well, not a straight-forward problem to solve in CFML.
One thing that I alluded to in that entry was that I'm including both the userAttributes and the flag rule in my data 👉 number calculation. It's not strictly necessary in order to get a number that represents the user; but if you don't then it doesn't solve for the "same users selected every time" problem. By adding the flag into the hashing algorithm, it introduces an element of randomness seeded on the flag itself, which is exactly what we need, so that user selection is randomized between all percentage-based flags.
Still, I was curious how well my algorithm distributes values across the range of possible values, so I did the math.
Does my algorithm (somewhat) evenly distribute those numbers across the range of possible values? (click for full size)
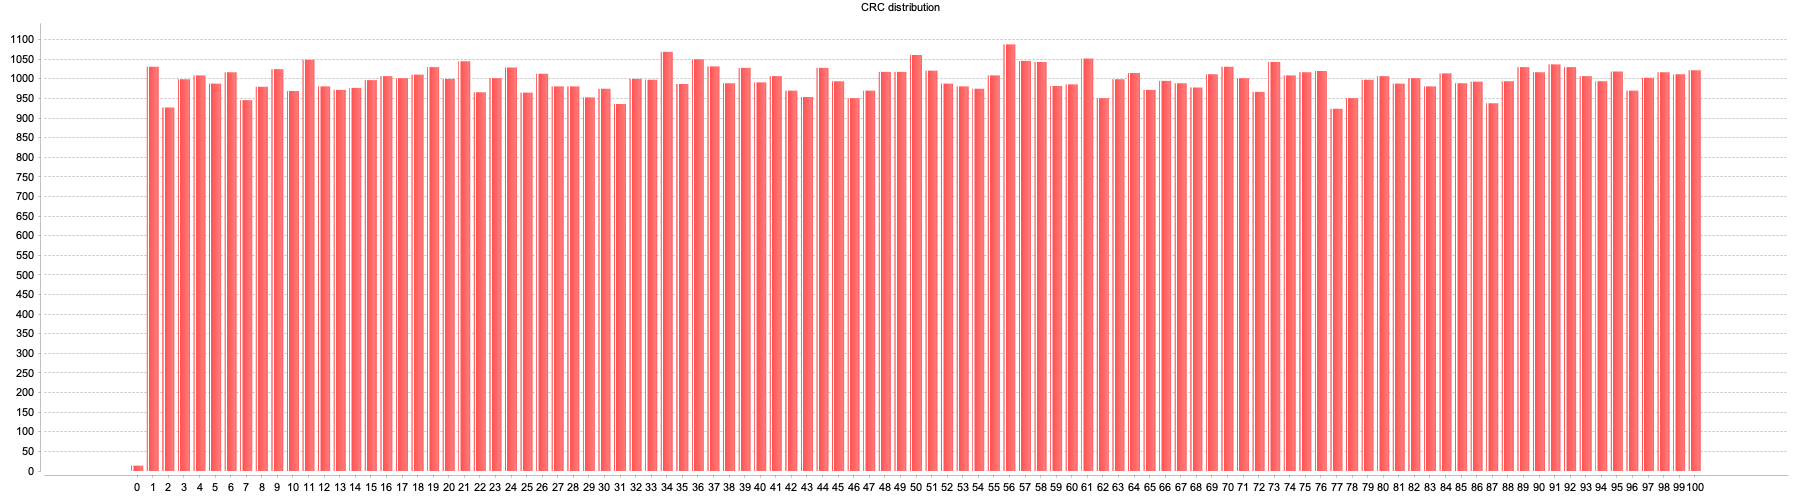
It sure seems like it. So how did I come up with those numbers?
The goal is to capture "CRC" values (apologies, I'm using the term CRC extremely loosely -- if you've got a better term in mind, please leave it in a comment!) for a series of inputs that are meant to represent unique users, each different from the last. In order to not simply be calculating the MD5 of an incrementing counter, I introduced a random string generator to produce a "name" for each userData object, too. And they were all tested against the same "rule".
<cfscript>
	semaphore = createObject('lib.semaphore');

	attempts = url.keyExists('attempts') ? url.attempts : 1000;

	distribution = {};
	for ( i = 0; i <= 100; i++ ){
		distribution[i] = 0;
	}

	for ( i = 1; i <= attempts; i++ ){
		userData = { name: RandomString(15), i: i };
		rule = { testing: 'yo' };
		result = semaphore.getUserRuleCRC( userData, rule );

		storeResult( result );
	}

	function storeResult( required numeric result ){
		//because of the way percentages are checked in semaphore with <=,
		//using ceiling ensures we're measuring apples to apples.
		place = ceiling(result * 100);
		distribution[place]++;
	}

	//https://lunaticthinker.me/index.php/cfml-generating-random-string/
	function RandomString(length, chars="ABCDEFGHIJKLMNOPQRST0123456789-") {
		rs = 0;
		theString = "";
		for (rs = 0; rs < arguments.length; rs++) {
			 theString &= Mid(chars, RandRange(1, len(arguments.chars), "SHA1PRNG"), 1);
		}
		return theString;
  }
</cfscript>

<cfchart format="png" title="CRC distribution" chartheight="500" chartwidth="1800">
	<cfchartseries type="bar">
		<cfloop from="0" to="100" index="d">
			<cfchartdata item="#d#" value="#distribution[d]#" />
		</cfloop>
	</cfchartseries>
</cfchart>
A note, if you care to run this code yourself: semaphore.getUserRuleCRC is a private method. I thought about including a public proxy or doing some work to use mixins to make it public as part of the above script, but that all seemed like a great waste of time when I can just toggle the function to public when I want to run the script. So you'll need to do the same.
You may have noticed that the chart I showed above has the Law of Large Numbers on its side, since I ran it for a set of 100,000 inputs. Indeed, if I run it for a million inputs the top of the chart looks even flatter. So let's have a quick peek at the results for 1,000 inputs instead: (click for full size)
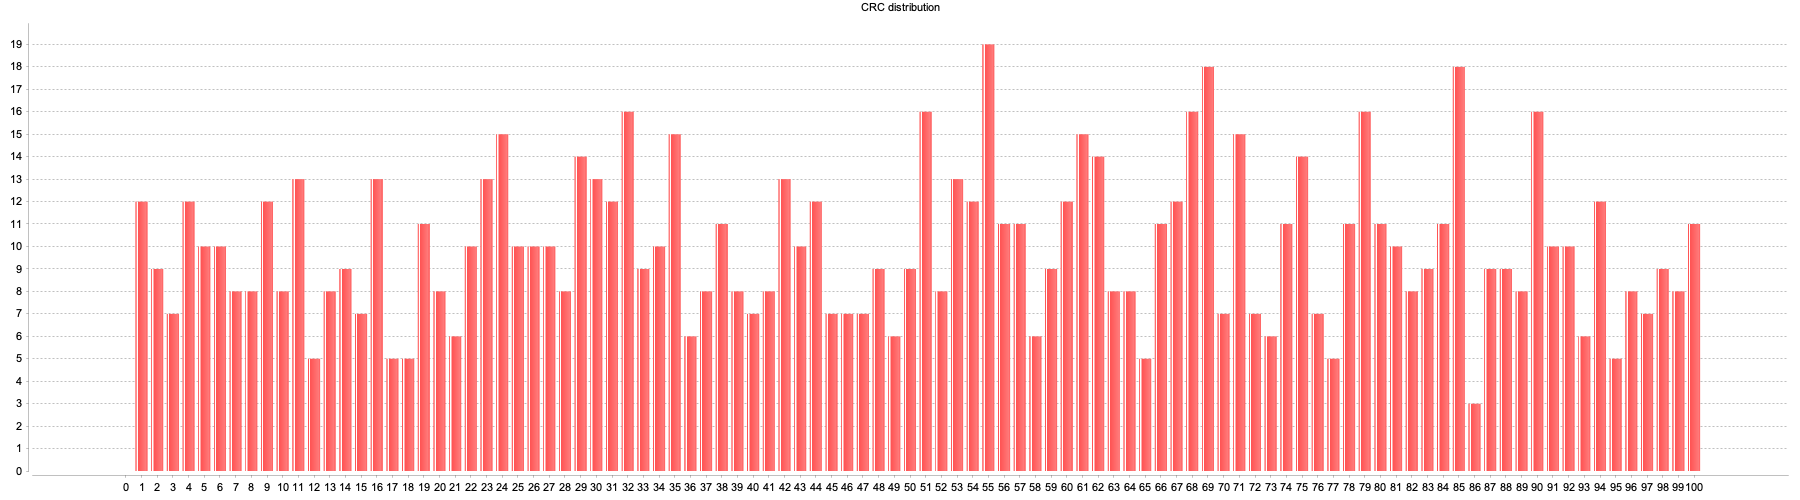
That is certainly not as evenly distributed, but honestly it's better than I expected for such a ridiculous algorithm as what I've done, and definitely useful for segmenting users. You may not get exactly 37% when you specify 37%, but you'll get much closer to 37% than you will to 0% or 100%, and at the end of the day, I think that's what really matters.
Maybe it's not such an insane algorithm after all?